Company
Expeditors, a Fortune 500 logistics company based in Seattle.
Role
Lead UX Designer
Product
exp.o Visibility is a web-based reporting tool that lets Expeditors' customers access their logistics data (shipments, orders, customs, and inventory), as well as view electronic document images. At the time of this project exp.o Visibility had about 30,000 external users and 10,000 employee users.
Project Summary
The goal of this project was to transform the reporting tool in exp.o Visibility so that it is usable and functional, enables customers to self-serve the information they need, and creates a positive user experience. We tackled this by employing UX design and research best practices, usability heuristics, proven interaction patterns, and the simplest possible workflows.
Problem
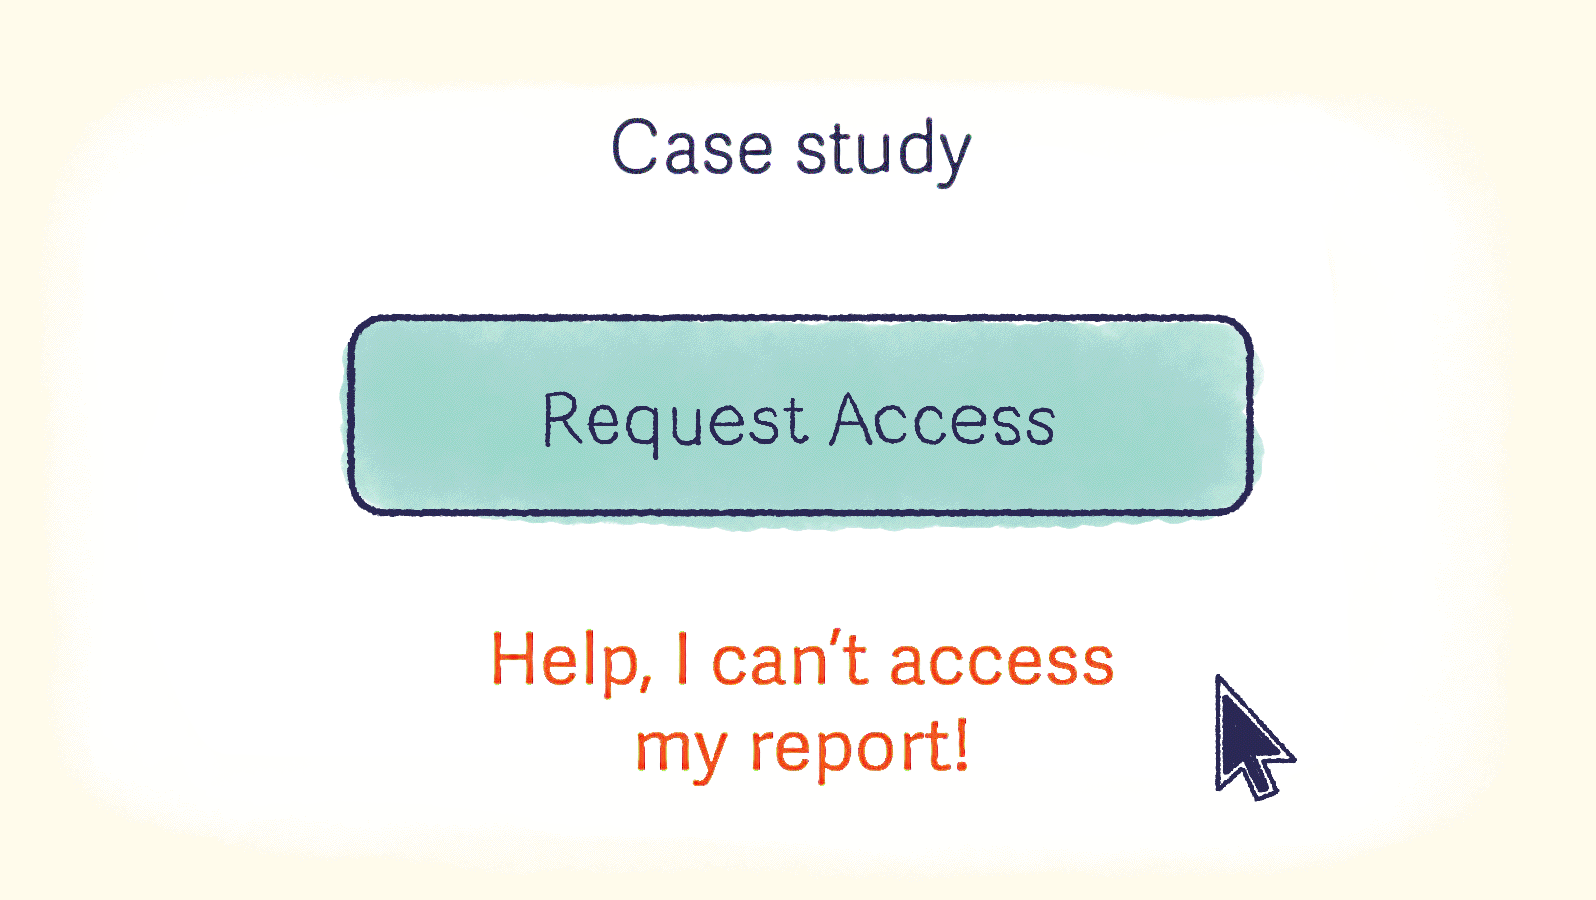
Due to usability and performance issues, customers would often rely on Expeditors representatives and the Support team to provide the reports they needed (using an internal-only, legacy system called Report Writer), instead of using exp.o Visibility to self-serve the information. Rather than getting the information they needed right away, it could sometimes take days.
There was also a goal to retire the legacy Report Writer system, which was difficult to update and maintain, but in order to do that we had to improve exp.o Visibility first.
Research/Analysis
We conducted an initial research sprint to validate assumptions about the system's usability. There was a lot of existing data to mine, such as previous usability studies, personas, and support tickets. Other methods used were contextual inquiry (during the visit to Keen) and heuristic review.
Some key things we learned:
- The design and information architecture of exp.o Visibility appeared to be based on its underlying subsystems, which resulted in reports being divorced from results, feature disparity between report and tracking result sets, suboptimal workflows and overall, a mediocre user experience.
- Creating a custom report was difficult and slow. The tabbed, "wizard" style report builder was confusing, and required users to create a report, save it, then find and run it to see the results. Each tab would load slowly, making the process time-consuming.
- The current system restricted users to creating a report on a single type of logistics information (e.g. shipments or orders or brokerage). Users wanted more flexibility to pick fields from any of these buckets in a single report.
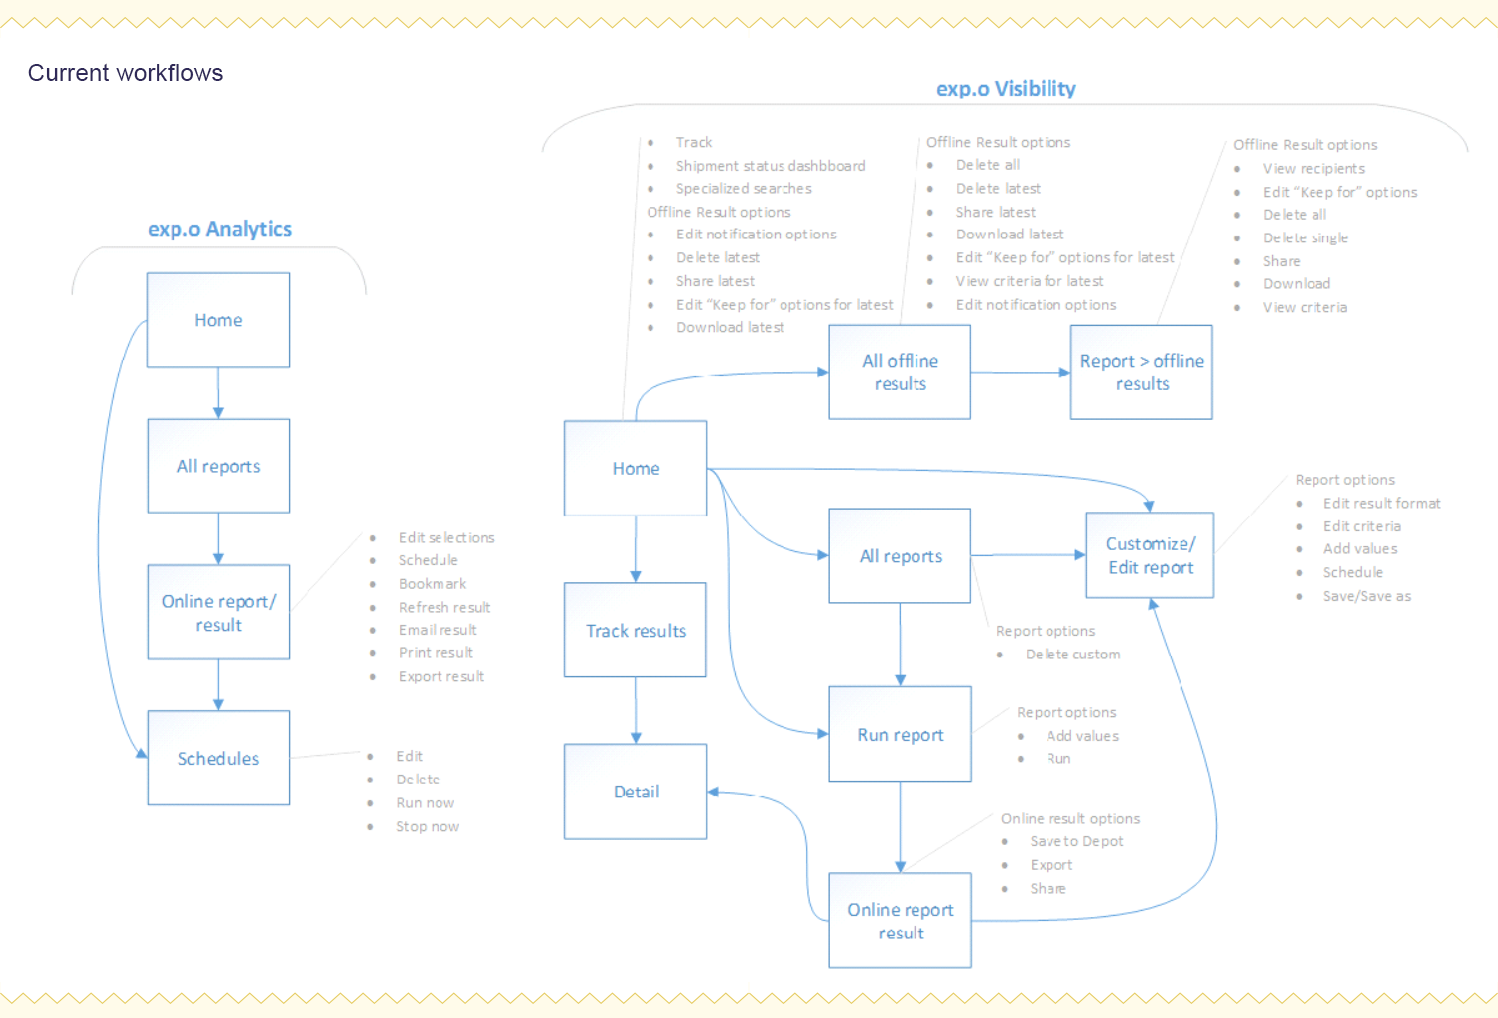
The old workflows
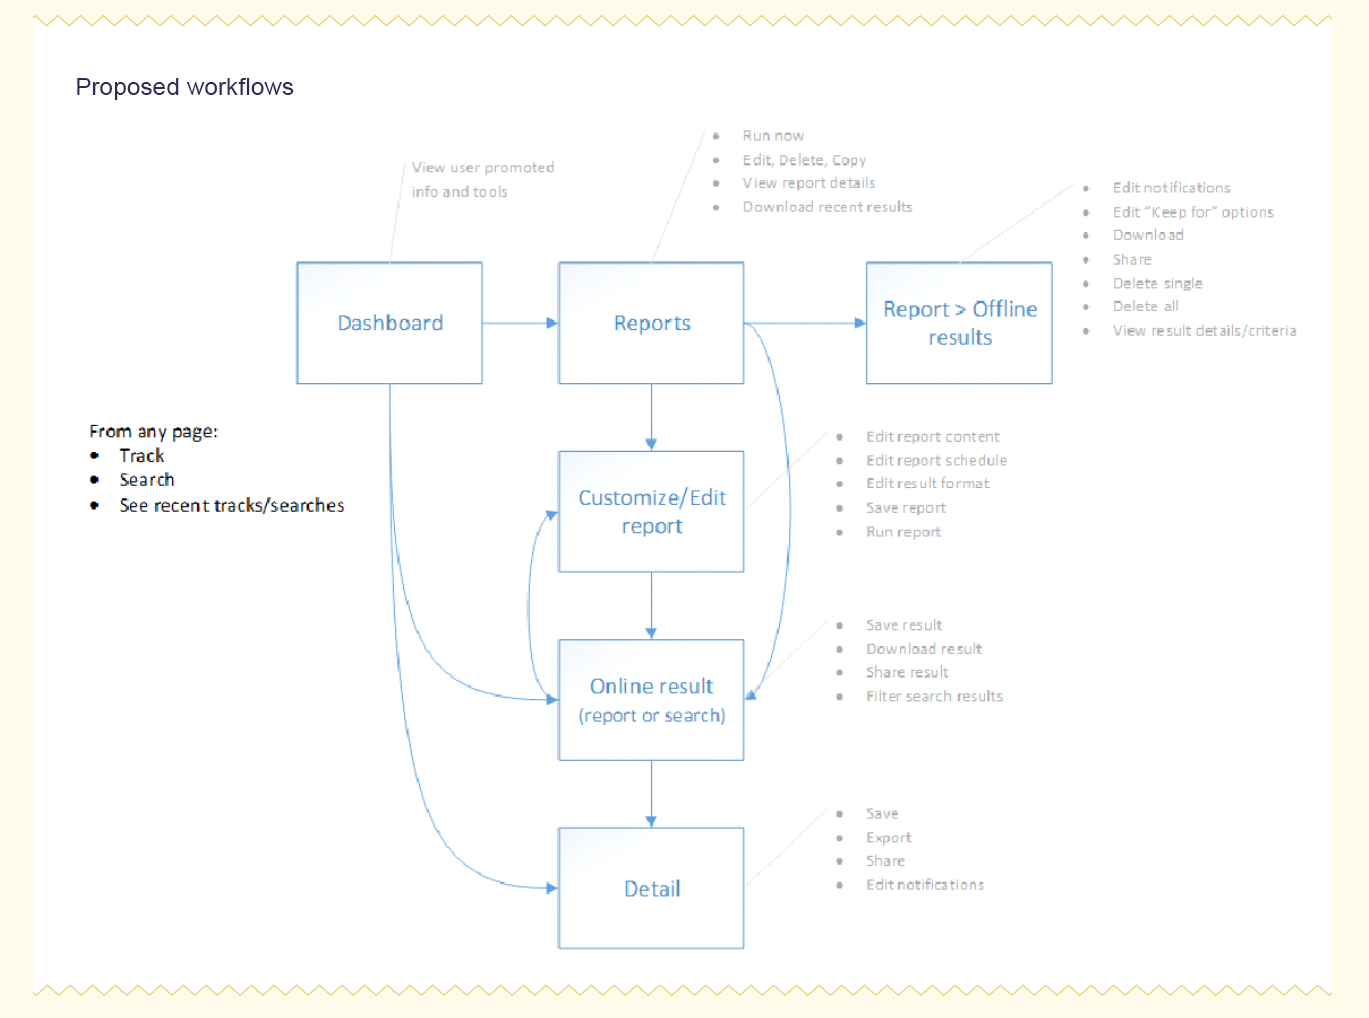
Proposed workflows
Design
Workflow and wireframes
We looked at existing design patterns in modern reporting tools to inform the initial wireframes and workflows. No need to reinvent the wheel! The new workflow made it easy to create/edit a report, and quickly see the results of each iteration.
We looked at existing design patterns in modern reporting tools to inform the initial wireframes and workflows. No need to reinvent the wheel! The new workflow made it easy to create/edit a report, and quickly see the results of each iteration.
First-click test
We validated the new workflow with a first-click test. In the first-click test, we presented users with scenarios to see where they would click first on a wireframe to accomplish the task. This test helped us confirm that we were on the right track before adding more detail and features.
We validated the new workflow with a first-click test. In the first-click test, we presented users with scenarios to see where they would click first on a wireframe to accomplish the task. This test helped us confirm that we were on the right track before adding more detail and features.
Initial prototype and usability test
We created an initial, clickable prototype and conducted usability tests with customers to further validate workflow and form controls.
We created an initial, clickable prototype and conducted usability tests with customers to further validate workflow and form controls.
Updated prototype and second usability test
Using feedback from the initial study, we updated the prototype and conducted another round of usability testing with customers. Some of the updates we made were to:
Using feedback from the initial study, we updated the prototype and conducted another round of usability testing with customers. Some of the updates we made were to:
- Simplify the workflow even more by displaying results on the customize report screen, instead of navigating the user to a separate screen to see them. This streamlined the process of iterating on a report and resolved some confusion we observed during the first round of testing.
- Provide an alternate way for users to add filters and columns to their report, since the drag and drop functionality was sometimes missed.
- Improve the organization of the available fields on the edit screen, and make them searchable.
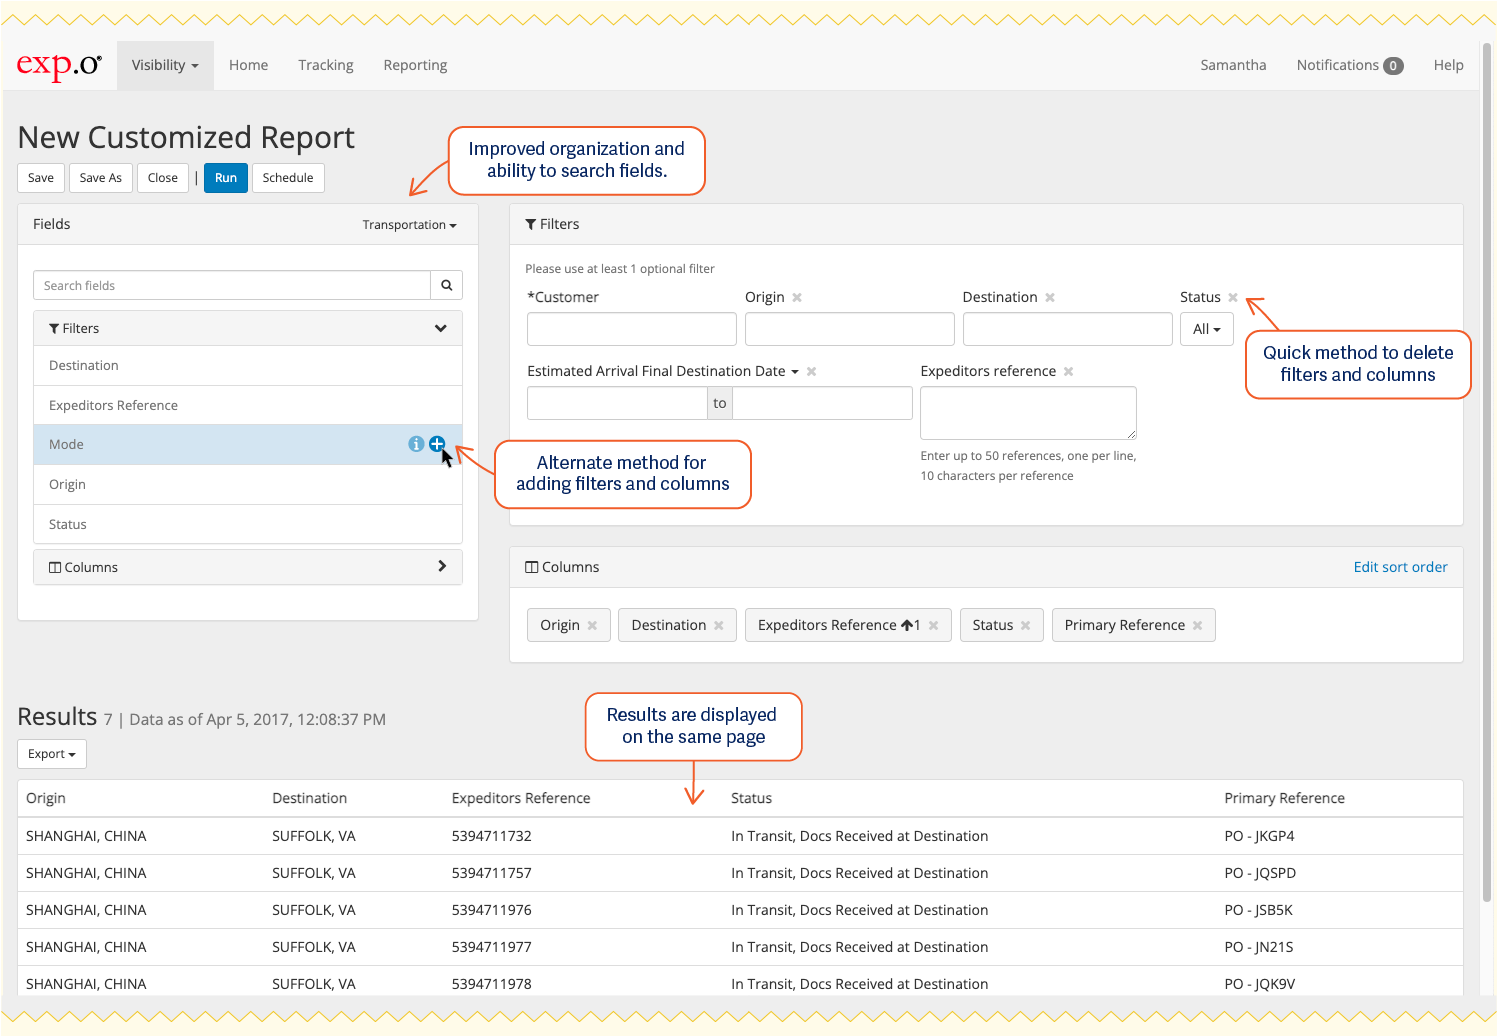
Updated prototype using feedback from initial usability test.
Mini-studies
After validating the workflows around running and customizing reports, we did some focused studies to dig deeper into the controls around creating, running, and scheduling a report, and viewing a report's results (e.g. exporting, sharing)
After validating the workflows around running and customizing reports, we did some focused studies to dig deeper into the controls around creating, running, and scheduling a report, and viewing a report's results (e.g. exporting, sharing)
Conclusion
At this point I left my role at Expeditors. The new workflow and some of the new features launched to beta soon after. The application isn't available to the public, but this demo video showcases the functionality.
Methods
- Interviews
- Contextual Inquiry
- Heuristic Review
- Competitor Analysis
- First-click Testing
- Wireframing
- Prototyping
- Usability Testing
- Contextual Inquiry
- Heuristic Review
- Competitor Analysis
- First-click Testing
- Wireframing
- Prototyping
- Usability Testing